We assist in selecting, implementing, and integrating the right tools for a specific organization and its processes as opposed to layering on systems of solutions which in the long run create inefficiency. Finally we assist by providing the understanding of how these tools work and their proper application for a given process.
What do our customers say about our quality assistance?
“Our auditor stated the internal audits (performed by Young Solutions) were very good.” – Dale Tempinson, White-Rodgers
Project Management
Program/Project, and Launch Management
If you are about to start a project or product launch and lack the internal resources we can help. Maybe the project has already started and you can see problems on the horizon. We can assist you to work through the issues and help to get the project on track.
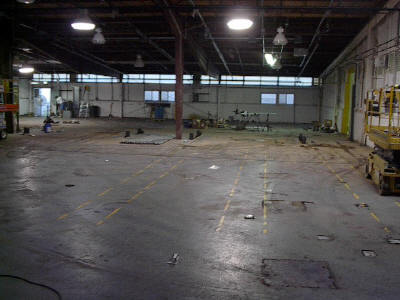
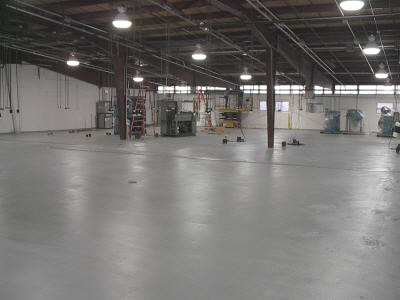
Before and After Pictures of Plant Upgrade
This customer utilized Young Solutions to assist with project management as they moved into a larger facility. We were charged with insuring the new plant was ready mechanically and aesthetically.
What our customers say about our help:
“Thanks for the information and for a great job!” – Martin Brooke Quality Director, PSM
Process Capability
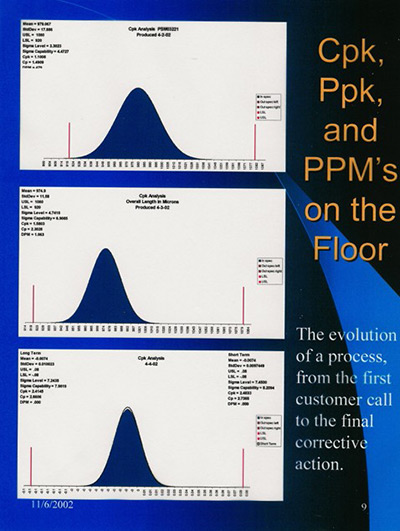
At other times a manufacturer may have an issue with non-conforming product that has reached their customer. Process capability analysis becomes a critical tool in establishing a picture of a particular process. It also becomes a long term tool used to understand the impact of different forms of process variation and the impact of corrective actions and process improvements which have been implemented over time.
We emphasize the best utilization of these tools to provide the highest return on investment for manufacturers. For example, many statistical purists will waste valuable time demonstrating process control and stability before looking at process capability. We have looked at process capability indices for decades and we can eliminate much of the redundancy of a standard approach.
What our customers say about our Process Capability Help:
“With the things we learned using Young Solutions it was well worth having them assist us.” – Hank Merkle, Engineering Director PSM
Corrective Actions & Root Cause
Corrective Actions
Corrective Actions can be performed in many formats. Eight Discipline approaches are popular in the US and other formats like the A3 and Quality Problem Report are popular in specific industries. They all have a common underpinning with an approach to understand the root cause of a situation and follow up with corrective action.
Root Cause Analysis
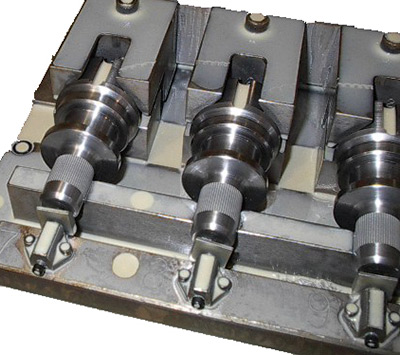
This part has a keyway which is cut on a CNC machine. The keyway was sometimes out of tolerance but process capability studies had shown this feature to typically be highly capable. The problem of oversize keyways seemed to occur infrequently and with a random pattern. Thinking there may be an issue with pressure the customer installed gauges for monitoring but no failures occurred during this evaluation.
Young Solutions assisted with the installation of a pressure transducer which was tied into the control logic of the system. This unit was able to pick up the infrequent drops in pressure that allowed the clamping system to relax enough to allow the part to move. These events were then associated with large power draws on the plants electrical distribution system that occurred when large machinery was turned on. While it was not possible to address this root cause, the transducers signal during these occurrences triggered additional controls to insure containment.
If you want to know more about the 8D process there is an article in the YSI blog.
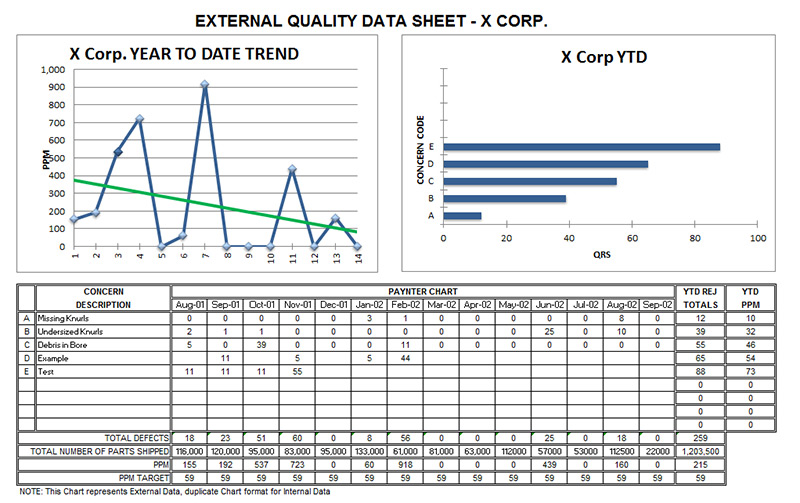
Paynter Charts
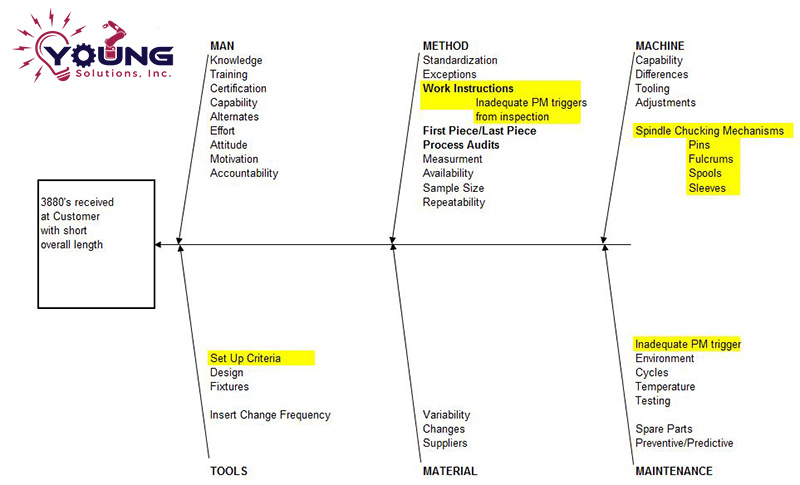
Fishbone Diagrams
Control Plans & FMEA’s
Control Plans
Control Plans come in many shapes and sizes but they all have a common intent. Many industries and companies optimize these features in a way that best suits their organization and its industry.
FMEA’s
Design and Process FMEA’s are used to anticipate and address potential failure mode’s and their effects. They can be particularly effective as a historical reference when designing new products and processes.
We have produced hundreds of control plans an FMEA’s for many different industries.
What our customers say about our control plan assistance:
“Our work went very well, and it was a great learning experience.” – Mike Royse, H&K Machine Service
Process Flow Diagrams
Process Flow Diagram
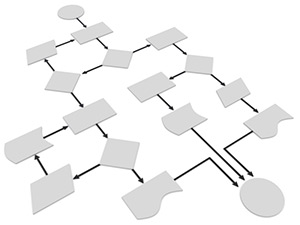
A Process Flow Diagram simply illustrates a process in a graphical format. The process flow is typically displayed in a sequential format from beginning to end. Some industries have specific standards for the symbols, however in many instances the symbol definition is left to the creator of the document. In such instances a legend is essential.
5S Methods

The five basic principles of the 5S methodology are quite simple. They are:
- Sort
- Set in Order
- Shine
- Standardize
- Sustain
There are several new iterations being promoted around the original 5S concept. Now we have Lean 5S and most recently 6S which is simply the addition of safety as a component. These are simply marketing methods which also detract from the core values of the 5S process. Don’t misunderstand, lean values and safety are essential and important components of the work place. A true understanding of 5S addresses the integration of these concepts within 5S instead of adding yet another flavor of the month.
Inspection Validation
Measurement Systems Analysis
Gage Repeatability and Reproducibility studies are the most common analysis format in measurement systems analysis, and Gage R&R’s are applied to many common measurement devices like Micrometers, Calipers, Bore Gages, etc.
MSA also deals with more complex measurement devices and helps in creating an understanding for fitness of use of these complex or unique devices.
Manufacturing Dictionary
A dictionary of common manufacturing terms is provided below for your convenience.
A2LA Testing and calibration laboratory. A2LA certification is a typical requirement in the automotive industry.
AIAG Automotive industry action group
APQP (Advanced Product Auality Planning) originated in the automotive industry and is essentially a methodology combining multiple quality tools product launches are successful.
BOS (Business Operating System) is unique from a QOS in that a BOS considers additional aspects relating to a business.
Cost of Quality is associated with the study of quality cost and payback ratios.
DFM (Design for Manufacturing) is a conscious activity during the design process to consider not only the final attributes of the finished part but also the ease of manufacturing of the part itself.
DFMEA A design FMEA deals with the attributes and factors associated specifically with the design of the product.
DOE (Design of Experiments) There are many approaches which may be utilized in a designed experiment, but in its most simplistic form a designed experiment develops a hypothesis and tests the results. Several different approaches and methods like those of Taguchi have been popularized as being a designed experiment. However this is somewhat narrow in scope and approach.
FMEA (Failure Mode and Effects Analysis) is a methodology to evaluate a process from beginning to end and associate risk factors with each of the operations. Failure modes are evaluated in terms of severity, occurrence, and detection. Corrective actions are considered based upon the results.
GDT ANSI 14.5 Y This standard helps to further commonize geometric dimensioning and tolerancing on the prints and drawings. It moves towards a higher utilization of geometries and symbols to describe features and tolerances. In organizations where the standard has been embraced it has provided gains in efficiency and quality of drawings. Similarly it creates issues for organizations unfamiliar with the standard as the symbology is in essence a foreign language.
OEE (Overall Equipment Effectiveness) considers the availability of equipment, production rate, and quality to produce a monitoring metric for a manufacturing process.
PFMEA (Process Failure Mode and Effects Analysis) is similar in nature but focuses more on process instead of product.
PPAP (Production Part Approval Process) is an automotive format utilized by suppliers for production part approval prior to a launch.
PPM Parts Per Million defects
QOS Quality Operating System
QS9000 is a technical standard commonly associated with the big three and AIAG, also known as the automotive industry action group.
Quality Circles was a methodology first attempted in United States in the 1970s. It entailed utilizing a group of individuals to solve issues on the floor. Historically they were misunderstood and met with limited success.
Root Cause is the most primary cause of a particular result. Often times peripheral causes are addressed when a quality problem appears, however without addressing the root cause the problem will appear again.
Six Sigma is a quality term popularized with an associated group of quality improvement methodologies. The name refers to a six standard deviation process spread considered highly desirable for near zero defects results.
SMED (Single Minute Exchange) of dies deals with optimization methodologies and quick change style tooling. By focusing on reduced set up time more time becomes available for production activities. Reduced set up time also helps to facilitate short run methodologies, and enhanced flexibility.
SPC (Statistical Process Control) is most commonly associated with production/process control charts.
TOPS (Team Oriented Problem-Solving) was the name associated with Ford’s 8D corrective action process when it was first launched.
TPM (Total Productive Maintenance) utilizes systems and metrics to ensure maintenance is performed at a high level. Things like OEE and production yields are common metrics to evaluate maintenance performance.
TS16949 is a technical specification associated with ISO 9000. It attempted to commonize requirements for the automotive industry. About 30{0f1f5cee2cf702555d7a06107e0a24726bf4475511e3cbd943df74ee38f28692} of automotive companies actively use this specification.
Variation is a concept related to the inherent variation of all processes and parts.